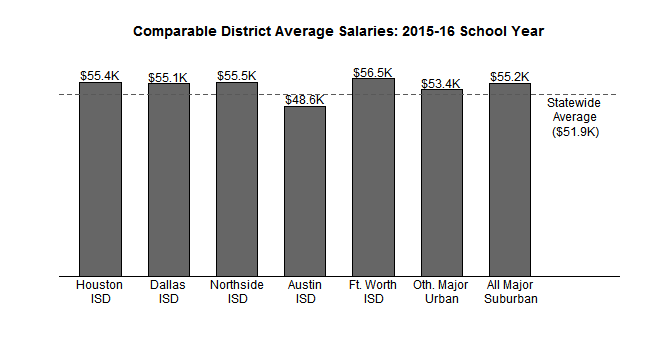
In Part 1 of this series, we compared the average salaries of school districts in Texas that are similar to Austin ISD, and we concluded that the average salary for Austin ISD is materially lower than its peer districts. In order to get a more complete picture of salary differences, we would need to account for the cost-of-living in each district; in theory, districts with higher cost of living would have to offer a higher salary in order to attract and retain teachers, who would otherwise look for higher paying employment. However, geographic variances in cost-of-living can be difficult to measure; not only is it conceptually hard to define, but existing data to support an analysis of any particular measure can be elusive or even non-existent. Luckily, a body of research exists that we can use to find answers to our questions.
In order to measure cost-of-living in any particular geographic region, we would ideally have location-specific price data on all of the individual products and services that are commonly consumed. We could then compare the cost variation from geography to geography in proportion to the amount typically consumed. For instance, we could measure the relative difference in cost for food-services, fuel & utility costs, housing, etc. and then weight those differences based on the percent of the typical household budget that each category represents; the resulting number would be the aggregate cost-of-living difference. There are a number of challenges with actually doing this type of analysis; many people could disagree on the list of products and services to use in such an analysis, data on location-specific price levels for most product categories is not readily available, and household budget composition is similarly fluid and difficult to measure.
If we cannot get a perfect measure of cost-of-living, then we should at least look for approachable alternatives. To start, we could look at housing costs. Not only are data and research readily available that show geographic variation in housing costs, but housing is a dominant factor in nearly all household budgets, so variances in this cost category should be highly correlated to variances in overall cost-of-living, however it’s defined.
The online real-estate company, Zillow, is a great source for research and data on housing market trends. In order to understand the geographic variation in housing costs, we can utilize their home value index and rental price index, both of which are readily available in the research section of their website. In comparing the most recent (June 2016) average house values in the metropolitan areas that surround Austin ISD and its peer districts, we can see that Austin has significantly higher average home values than the others: 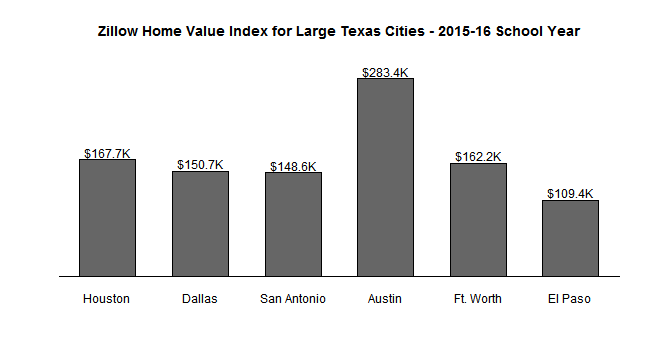 While this difference is stark, and tells us a lot about geographic variations in affordability, we may instead want to look at rental cost variation. Many factors can contribute to the relative attractiveness of renting or buying in a given market, but the cost of renting could be a more appropriate factor in the cost-of-living since it does not account for future expectations of home values, and so better represents the marginal cost of housing in a given area. In this comparison, Austin is still the most costly, but the difference is less pronounced:
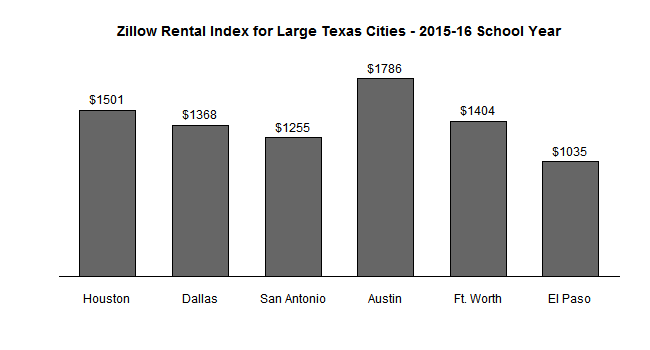
Another approach to measuring the cost-of-living is found in the research of Dr. Lori Taylor of the Bush School of Government & Public Service at Texas A&M University. This method focuses on the measurement of variations in salaries earned controlling for factors that commonly dictate wages, such as job type, age, and other demographic information. In theory, geographic wage variation should be largely driven by cost-of-living differences. Dr. Taylor has developed a ‘Comparable Wage Index’ (CWI) to measure these geographic wage differences using data from the U.S. Census (and other sources, see here for details).
When we use either the CWI methodology or Zillow’s rental price index to adjust the district-level average salaries, Austin ISD remains the lowest of its peer districts: 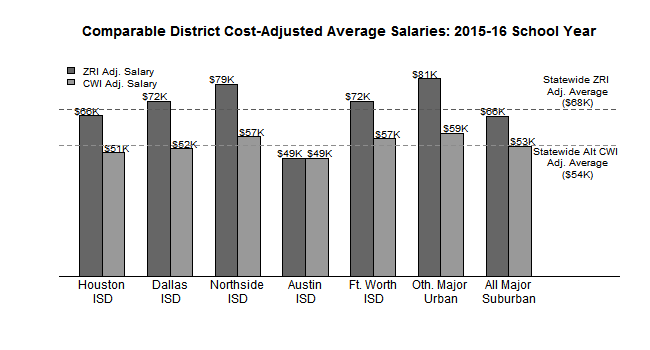
The data are painting a grim picture for Austin ISD teachers; they face the highest housing costs and are paid the lowest salary among their peer districts. It’s natural to ask how this can be; what force is acting against the Austin ISD budget that makes it impossible to pay their teachers a fair wage. One clear candidate is the so-called ‘Robin Hood’ law that forces Austin ISD to pay a substantial portion of it’s revenue into a general state fund. In the next post, we’ll look deeper into the relationship between these payments and the salary gap for Austin ISD.